.png)
Profiles
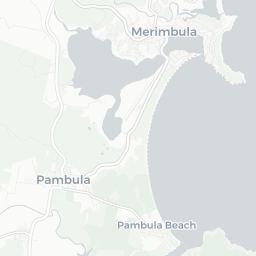
Nearby Suburbs
Real Estate Market: Is Broadwater (Bega Valley - NSW) NSW 2549 a Good Suburb to Buy Into?
Housing Market in Broadwater (Bega Valley - NSW)

Sources: Property Listings, TORREN and Microburbs, 2006 - 2023
| Field | Value | VS Capital Region | Trend | |
|---|---|---|---|---|
| Premium | Premium | Premium | ||
| Premium | Premium | Premium | ||
| Premium | Premium | Premium |
Housing Supply in Broadwater (Bega Valley - NSW)

The higher the supply score the more supply is on the market, both current and future.
Sources: ABS, GEOSPATIAL, Property Listings, PLANNING ALERTS and Microburbs, 2002 - 2031
Sources: ABS, GEOSPATIAL, Property Listings, PLANNING ALERTS and Microburbs, 2002 - 2031
Broadwater (Bega Valley - NSW)
47.8%
Broadwater (Bega Valley - NSW)
47.8%
Capital Region
40.2%
Capital Region
40.2%
| Field | Value | VS Capital Region | Trend | |
|---|---|---|---|---|
| 0 | Bottom 38% | Data for Jun 2025 | ||
| 2.7 | Top 43% | Data for Jul 2023 | ||
| Premium | Premium | Premium | ||
| 8 lots | Top 44% | Data for May 2021 | ||
| Premium | Premium | Premium | ||
| Premium | Premium | Premium | ||
| Premium | Premium | Premium | ||
| 0 | Bottom 24% | Data for Mar 2025 |
Housing Stock Quality in Broadwater (Bega Valley - NSW)
The higher the score, the higher the quality of the houses and units.
Sources: ABS, GEOSPATIAL and Microburbs, 2006 - 2023
Sources: ABS, GEOSPATIAL and Microburbs, 2006 - 2023
| Field | Value | VS Capital Region | Trend | |
|---|---|---|---|---|
| 100.0% | Top 31% | Data for Jan 2021 | ||
| 2.4 | Bottom 42% |
|
||
| 0.0% | Bottom 37% | Data for Jun 2023 |
Development Restrictions in Broadwater (Bega Valley - NSW)

The higher the score, the more easily density can be increased.
Sources: GEOSPATIAL, TORREN, ABS and Microburbs, 2011 - 2023
Sources: GEOSPATIAL, TORREN, ABS and Microburbs, 2011 - 2023
Broadwater (Bega Valley - NSW)
29.6%
Broadwater (Bega Valley - NSW)
29.6%
Capital Region
30.5%
Capital Region
30.5%
| Field | Value | VS Capital Region | Trend | |
|---|---|---|---|---|
| 5.3 sq km | Bottom 42% | Data for Jan 2021 | ||
| 11.0% | Top 10% | Data for Jun 2023 | ||
| 1 | Bottom 42% | Data for Jun 2023 | ||
| 6600 sqm per resident | Top 21% | Data for Jan 2021 |
Risk in Broadwater (Bega Valley - NSW)

The higher the score, the more exposed households are to financial stress.
Sources: ABS, Property Listings, TORREN and Microburbs, 2006 - 2023
Sources: ABS, Property Listings, TORREN and Microburbs, 2006 - 2023
Broadwater (Bega Valley - NSW)
37.5
Broadwater (Bega Valley - NSW)
37.5
Capital Region
36.5
Capital Region
36.5
| Field | Value | VS Capital Region | Trend | |
|---|---|---|---|---|
| 39 | Top 31% | Data for Jun 2023 | ||
| 71 | Bottom 15% | Data for Jun 2023 | ||
| 68 | Bottom 15% | Data for Jun 2023 | ||
| 24.7% | Top 36% |
|
Housing Demand in Broadwater (Bega Valley - NSW)
The higher the score, the more demand their is for housing in the area, both current and future.
Sources: ABS, TORREN, Property Listings and Microburbs, 2006 - 2030
Sources: ABS, TORREN, Property Listings and Microburbs, 2006 - 2030
Broadwater (Bega Valley - NSW)
48.8%
Broadwater (Bega Valley - NSW)
48.8%
Capital Region
56.9%
Capital Region
56.9%
| Field | Value | VS Capital Region | Trend | |
|---|---|---|---|---|
| Premium | Premium | Premium | ||
| 13500 | Top 42% |
|
||
| 77400 | Top 39% |
|
||
| Premium | Premium | Premium | ||
| 36500 | Top 33% |
|
||
| Premium | Premium | Premium | ||
| Premium | Premium | Premium |
Turnover Rate by Street (5)
| Turnover rate | Street | Turnover Label | Turnover Years | Year |
|---|---|---|---|---|
| 75.0% | Hardakers Rd | average turnover | Every 13.3 years (average turnover) | 2025 |
| 53.8% | White Fox Rd | quite tightly held | Every 18.6 years (quite tightly held) | 2025 |
| 54.5% | Landing Rd | quite tightly held | Every 18.3 years (quite tightly held) | 2025 |
| 40.0% | Blackwood Ln | very tightly held | Every 25.0 years (very tightly held) | 2025 |
| 140.0% | Princes Hwy | very high turnover | Every 7.1 years (very high turnover) | 2025 |
Percent of Renters by Street (8)
| Percent of Renters | Street |
|---|---|
| 18.2% | Princes Hwy |
| 0.0% | Broadwater Ln |
| 0.0% | Hardakers Rd |
| 0.0% | Heather Ct |
| 0.0% | Landing Rd |
LGA Details (1)
| Headline | Place | Datetime |
|---|---|---|
| Local government area | Bega Valley |
Planning Applications: Other (1)
| Headline | Place | Date |
|---|---|---|
| Cultural Festival - Bega Valley Shire Council 010.2021.00000365.001 | 4381 Princes Hwy, Broadwater, NSW 2549 | 29 Jun 2021 |
Planning Applications: Dwellings (1)
| Headline | Place | Date |
|---|---|---|
| Dwelling House - Bega Valley Shire Council 010.2021.00000310.001 | 27 White Fox Rd, Broadwater, NSW 2549 | 24 Jun 2021 |
Recently Sold Houses (18)
| Address | Price | Bedrooms | Bathrooms | Garage spaces | Date sold | Subdivisible into | Sale Type |
|---|---|---|---|---|---|---|---|
| 4 Landing Rd | $970,000 | 29 Apr 2024 | 0 | On Market | |||
| 91 Landing Rd | $1,760,000 | 3.0 | 2.0 | 4.0 | 20 Feb 2023 | 0 | On Market |
| 91 Landing Rd | $1,760,000 | 20 Feb 2023 | 0 | On Market | |||
| 91 Landing Rd | $1,760,000 | 3.0 | 2.0 | 20 Feb 2023 | 0 | On Market | |
| 28 Blackwood Ln | Price Withheld | 5.0 | 3.0 | 5.0 | 16 Dec 2022 | 0 | On Market |
Recently Sold Units (100)
| Address | Price | Bedrooms | Bathrooms | Garage spaces | Date sold | Sale Type |
|---|---|---|---|---|---|---|
| 4 Landing Rd | $970,000 | 29 Apr 2024 | On Market | |||
| 4 Landing Rd | $970,000 | 29 Apr 2024 | On Market | |||
| 4 Landing Rd | $970,000 | 29 Apr 2024 | On Market | |||
| 4 Landing Rd | $970,000 | 29 Apr 2024 | On Market | |||
| 4 Landing Rd | $970,000 | 29 Apr 2024 | On Market |
Loading entities ..